

With the markets near historic highs, it’s more important than ever to consider other investment options.
January 10, 2022 – The first few weeks of 2022 have seen significant volatility in equities, but in the big picture, most indices remain at historically high levels. Meanwhile, the valuations of other asset classes—like bonds and housing—are at or near historical highs, meaning that investors have the opportunity to do well even if they’re not thinking strategically about their portfolio. But seasoned investors know that asset classes historically go up and down, and it’s rare to see them rising in sync. While no one can predict the future, asset classes may not remain at their current levels.
For that reason, we believe it’s more important than ever to think about diversifying across a wide range of asset classes, including some that don’t have as much correlation with stocks and bonds, like alternative investments.
Historical Highs For Many Asset Classes
To see how rich the current market is, consider the baseline metrics for asset classes. Regarding equities, as of January 2022, the Dow Jones Industrial Average, Nasdaq Composite, and S&P 500 had all experienced some dips, but were still near their record highs.1 Same with the MSCI World Index, which looks at global equities. 2
Drilling down one level to price-to-earnings metrics, the Shiller PE Ratio—which looks at stock prices as a multiple of average earnings over the previous 10 years—is at its second-highest level in history, dating back to the late 19th century. The only previous time it was higher was in 2000, at the height of the dot-com bubble3 (the Shiller PE Ratio differs from standard PE ratios in that it looks at 10 years of earnings, making it less prone to wild swings in volatility due to short-term effects).
Shiller PE Ratio
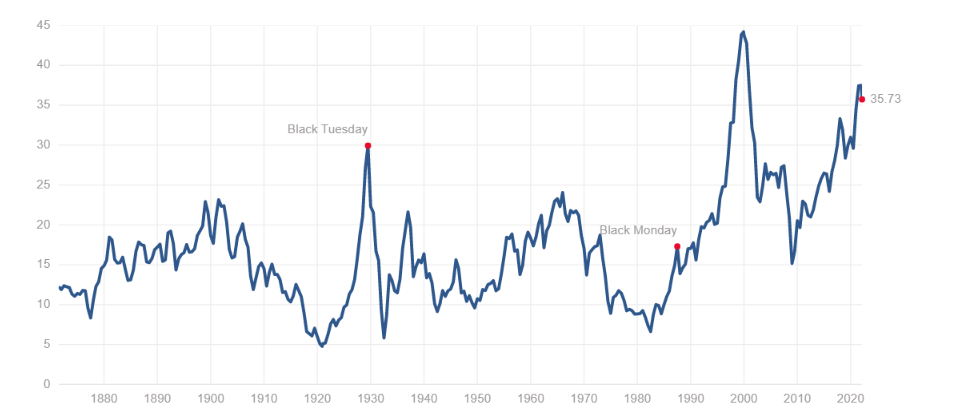
SOURCE: “Shiller PE Ratio,” multpl.com/shiller-pe, Feb. 21, 2022. Price earnings ratio is based on average inflation-adjusted earnings from the previous 10 years, known as the Cyclically Adjusted PE Ratio (CAPE Ratio), Shiller PE Ratio, or PE 10.
Another famed metric, the Buffett Indicator, should also give investors pause. The Buffett Indicator—developed by, yes, Warren Buffett—looks at the ratio of total stock market value in the US to Gross Domestic Product (GDP). In early 2021, we published a blog post about the Buffett Indicator suggesting that it was indicating the US stock market was potentially overvalued. Since then, the number has declined somewhat—from 224% of the long-term trend line to 193%— but still remains well above historical averages.4
Bonds are very expensive as well. There are different categories—corporates, high-yield, municipal, and others—so it’s hard to reduce the total asset class to a single number. But looking strictly at US government bonds, the current yield on 10-year Treasuries is about 1.9%, near all-time lows.5 With bonds, yields and prices move in opposite directions, meaning that Treasury prices are near all-time highs. That said, with the Fed all but certain to raise interest rates this year, bond prices will likely fall.6
Last, consider real estate. The S&P/CoreLogic/Case-Shiller National Home Price Index has been climbing steadily for the past decade, and it increased more than 10% in 2021 alone.7 Look around in most major cities and the combination of low interest rates and limited housing stock has meant that houses going onto the market receive multiple bids and generally sell faster than they might have in the past. What’s more, the prospect of rising interest rates could push prices up even faster, since anyone even considering a home purchase may feel like they need to do so now, rather than paying higher rates in the future.
Robert Shiller is a good tour guide for the current investment environment. The author of Irrational Exuberance and a Nobel Laureate in economics, he was among the first to highlight that stock prices are driven largely by behavioral metrics among investors, rather than by a rational analysis of a company’s underlying performance. In addition, he accurately predicted the stock market correction in 2000 and the collapse in housing prices leading to the global financial crisis. Shiller’s current take on the market? In a recent New York Times piece, he wrote about high valuations across asset classes and said, “Clearly, this is a time for investors to be cautious.”8
What does it mean to be cautious when valuations are unprecedented? Among other things, it means that it is more important than ever to consider the fundamental principle of diversification. By staying disciplined and looking beyond the currently expensive asset classes, investors can make sure that they hold a wide range of investment categories—especially those that are not correlated with each other. Alternative investments can be a means of diversifying and reducing the overall correlation to traditional asset categories.
At the same time, some types of alternative investments may offer value in different ways. For example, non-traded alternatives typically consist of assets—ranging from real estate to the debt of privately held companies—that are not easily bought and sold on public markets. As a result, the market for these assets tends to be less efficient—which means that managers can sometimes capitalize on those inefficiencies to identify investments that may be undervalued. To be clear, there’s no guarantee that non-traded alternatives will outperform publicly traded investments, but they offer investors another option if they’re trying to diversify beyond traditional asset classes in order to find opportunities to generate returns.
Considering the full range of investment options isn’t always easy, particularly when it seems like investors can put their entire portfolio into a single asset class and typically generate high returns. That may be true for shorter periods like the current one, but history has shown the value of diversification during periods of volatility.
Represents CNL’s view of the current market environment as of the date appearing in this material only. There can be no assurance that any CNL investment will achieve its objectives or avoid substantial losses.
1 Yahoo! Finance, Yahoo!, Feb. 4, 2022.
2 “MSCI World IDX,” CNBC.com, Feb. 4, 2022.
3 “Shiller PE Ratio,” multpl.com/shiller-pe, Feb. 21, 2022.
4 “Buffett Indicator,” Currentmarketvaluation.com, Jan. 27, 2022.
5 “U.S. 10 Year Treasury,” CNBC.com, Feb. 4, 2022.
6 Kate Dore, “Here’s how rising interest rates may affect your bond portfolio in retirement,” cnbc.com, Jan. 19, 2022.
7 “S&P CoreLogic Case-Shiller U.S. National Home Price NSA Index,” S&P Dow Jones Indices, data as of Nov. 2021.
8 Robert J. Shiller, “Stock, Bond and Real Estate Prices Are All Uncomfortably High,” The New York Times, Oct. 1, 2021.
CSC-0123-2643023-INV-E