

Oct. 26, 2022 – By just about any measure, 2022 has been a rough year for stocks. The first six months represented the worst such period in more than 50 years.1 The S&P 500 fell more than 20% during that period.2 Inflation, rising interest rates, geopolitical instability and other factors have also impacted the market. Given those declines, stocks are more attractive on a relative basis compared to their highs in 2021. But in absolute terms? Not so fast.
One metric that has proven reliable as a high-level benchmark of overall market valuation is the Buffett Indicator. (It’s called the Buffett Indicator because the famed investor once called it the best measure of valuations, though he has since played down his enthusiasm for using only one measurement.)3
We’ve written about the Buffett Indicator in the past, back in early 2021, but because the markets have experienced such fluctuation recently, it’s worth taking another look.
Digging into the Numbers
The Buffett Indicator is a straightforward calculation: total market cap divided by GDP. You can think of it as weighing the overall value of public equities against the value of the goods and services that those companies produce.
For the total market cap, the aggregate value of the Wilshire 5000 was $40.2 trillion as of late October. At that same time, GDP — reported each quarter by the U.S. Bureau of Economic Analysis (part of the Commerce Department) — stood at $25.5 trillion. Based on those two data points, the overall indicator stood at approximately 158.3
Like most indices, this number doesn’t say much in isolation, but if you look at how the number has shifted over time, a story emerges. The low point for the indicator was about 32.7 in July 1982, when the U.S. was in a deep recession. And the high was about 202 in August 2021.4 Dating back to 1995, the Buffett Indicator’s long-term average was 109. During the dot-com bubble of 2000, a period when many experts considered the stock market overvalued and due for a correction, it was approximately 140.5 (You read that right—stocks are more expensive today than at the height of the dot-com bubble.) Even after falling from north of 200 to below 160, it remains higher than its historical trend line in absolute terms.
For investors, this is one indicator that while stocks may be less expensive now than they were a year ago, they’re still not cheap.
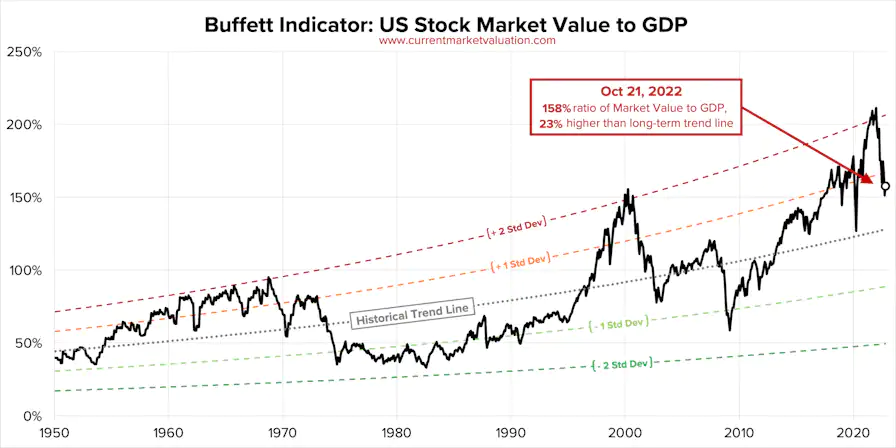
SOURCE: “The Buffett Indicator,” CurrentMarketValuation.com, Oct. 21, 2022.
A Renewed Argument for Diversification
A couple of caveats are in order. First, this is just one number (albeit one with a pretty good track record and an endorsement by one of the most famed investors of our era). Any assessment of market valuation should incorporate a range of data.
Second, it’s impossible to time the market, so investors who might be waiting for continued declines in stock prices so that they can buy at the bottom are probably taking the wrong approach. Stocks are clearly part of an overall plan for most investors. However, given that they have had a strong rally for the past decade, future returns may be tempered as valuations return to something closer to historical norms.
Last — and perhaps most important — the fact that stocks are still expensive is a renewed argument for a long-term approach that emphasizes the fundamentals. That means a broad-based portfolio with strong diversification from a wide range of asset classes (including alternative investments) and a long-term mindset. Stock valuations will rise and fall, but most investors should apply that kind of disciplined focus on the fundamentals to achieve their goals.