

Jan. 11, 2021 – At the end of 2019, people thought the stock market was volatile. Since then, the ride has only gotten bumpier. The impact of COVID-19 in the spring sent stocks plunging, but they recovered within weeks, and as of late 2020, most indices are at or near historic highs. But at least one metric, espoused by Warren Buffett, says that the current market may be overvalued.
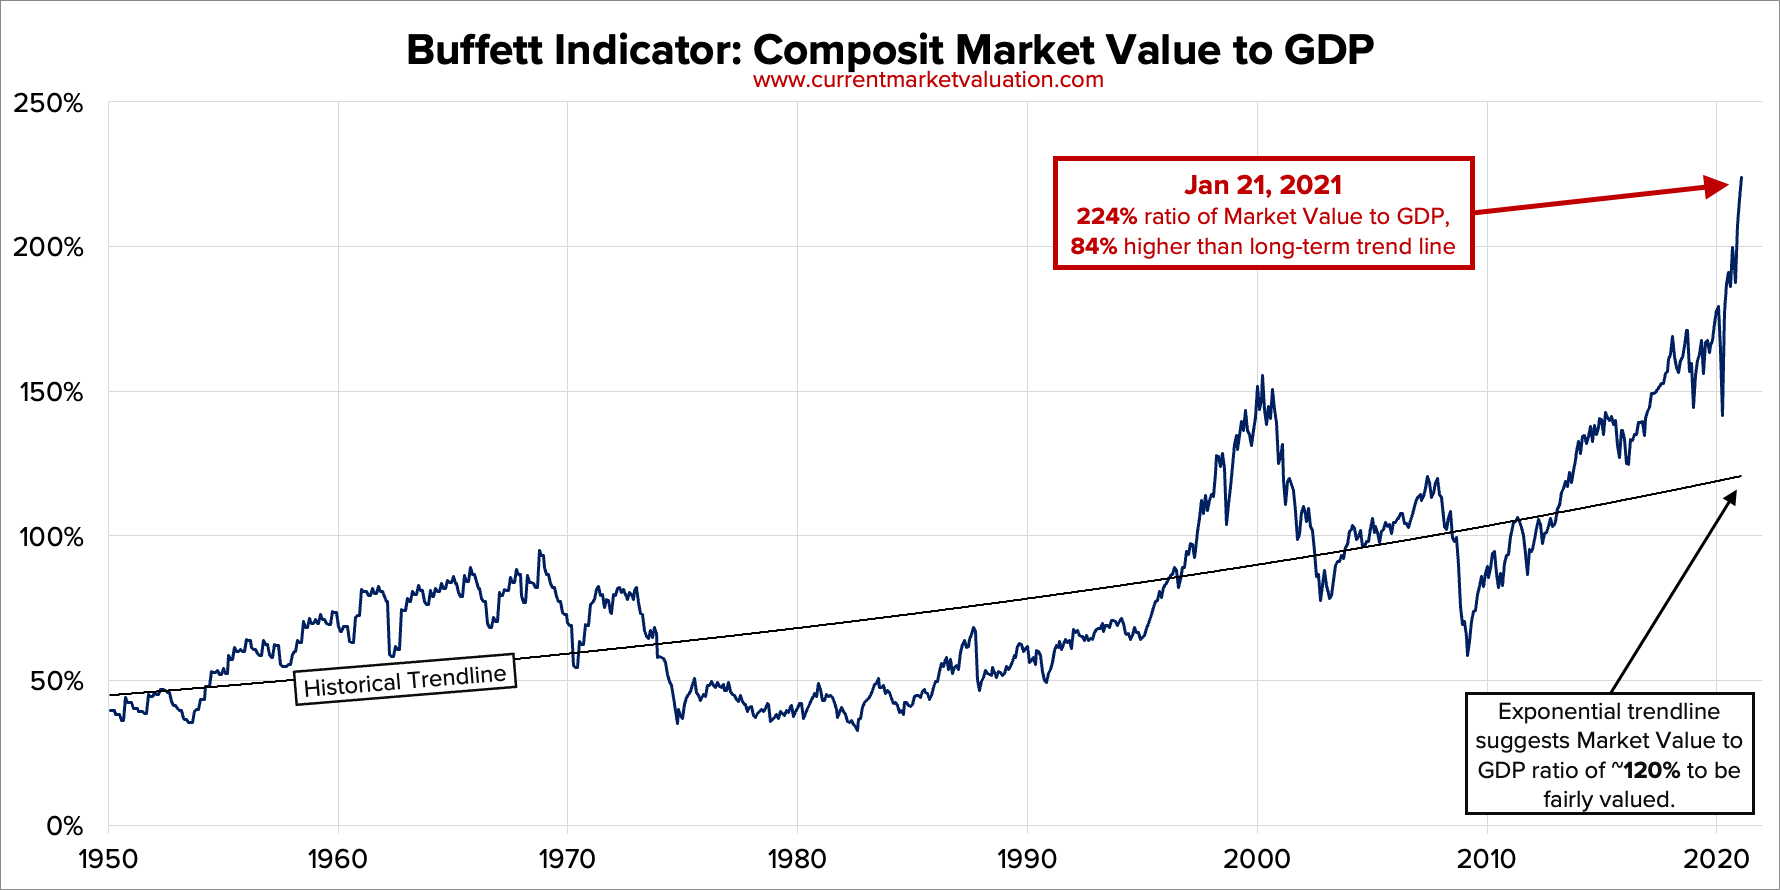
The so-called “Buffett Indicator” looks at the ratio of total stock market value to Gross Domestic Product (GDP). Add up the total market cap of all public companies and divide that by the economic output of the U.S. economy. Of course, it’s always tricky to reduce something as complex as the stock market to a single number, but Buffett has said that this ratio is “probably the best single measure of where valuations stand at any given moment.”1 And right now, that ratio is extremely high.
Dating back to 1970, the low point for the Buffett Indicator was in the recession of 1982, when it dipped to 32.7%. During the financial crisis of 2009, it fell to nearly 50%. Since then, however, it has climbed steadily (with a few dips along the way) to more than 186.4% in December 2020.1 The last time the indicator was anything even close to this percentage was in 2000, and the dot-com crash followed soon after.
SOURCE: “Buffett Indicator: Strongly Overvalued,” Currentmarketvaluation.com, Dec. 3, 2020.
To be clear, the Buffett Indicator doesn’t say that the market will tank soon. There are many external factors—like the government’s ability to step in to stabilize markets, among other things—that come into play. And it is not a perfect gauge either. GDP does not factor in income earned overseas, and companies listed in the U.S. don’t necessarily contribute much to the American economy.2
But the indicator does suggest that by historical standards, stocks may be expensive right now. For your clients, that means that it may be time to rebalance their portfolio, ensuring that the appreciation in stock prices has not left them overconcentrated in that asset class.
Looking Beyond Bonds
Historically, a basic diversification strategy was to build a portfolio that was 60% stocks and 40% fixed-income assets like bonds. In the current environment, however, that may not provide sufficient diversification for your clients to achieve their financial goals. It is important to note however, diversification does not guarantee investment returns and does not eliminate the risk of loss. At present, bonds are offering extremely low interest rates, due in large part to government efforts to boost economic activity during the pandemic. Short-term interest rates are near zero, and the yield on 10-year treasury bonds is only around 1%. There is nothing inherently wrong with bonds, but they face headwinds right now, meaning that investors may want to consider other non-equity asset classes.
To that end, consider exploring your clients’ level of diversification and level of exposure to all asset classes, including alternatives such as real estate, private capital, private debt, and other categories. While this is always good advice, when the Buffett Indicator is blinking red, it becomes even more critically important for investors.